The Unified Streaming Power Index: Q1 2026 Inaugural Rankings

Upfront season is upon us. The NewFronts start today. And Nielsen is taking a few days to think about the numbers. Our team has been building an open source solution to the cumbersome dependence on television measurement. The fundamental job to be done is to quantify attention, a constantly moving target that State of Streaming is uniquely positioned to track. If you'd like to get in touch to be a part of this effort, please email me at tim@stateofstreaming.com, I'd love to hear what you think.
The Problem We Set Out to Solve
Attention is the currency of time, and mindshare is the only proven path to marketshare.
Every brand that dominates its category got there the same way: by occupying mental real estate in more living rooms, more often, with more focus than its competitors. Every media plan is ultimately a bet on doing exactly that. Renting genuine human attention, in as many homes as possible, with a positive return on your investment.
Two weeks ago, we reported that Nielsen delayed its February Gauge report after clients raised concerns about the ARF DASH methodology integration. The same week, a CIMM/4As study confirmed what you're likely already feeling: 43% of advertisers rated cross-platform measurement as a major or severe barrier. Samba TV showed that 12 of the top 20 TV advertisers spent more money to reach fewer households in the same period.
We also reported that Amazon and Netflix are building vertically integrated advertising systems that make cross-platform interoperability irrelevant to their own businesses. At the end of that piece, we introduced The Grid: an open-source, directional methodology for comparing streaming apps against one another as television measurement continues to evolve.
We started with a simple denominator. Of the 101,582,619 U.S. Census households with broadband (cable, fiber optic, or DSL), what percentage can you reach on each streaming app?
The Unified Streaming Power Index is our answer to that question.
Why Addressable Household Reach Is the Foundation
The most fundamental question a media buyer faces has not changed: for any given neighborhood in America, how many homes out of every ten can I actually reach, and what is the quality of the attention waiting inside those homes?
Addressable household reach is the denominator that governs everything else. How should you assess an app with world-class content and pristine ad loads is but that only reaches two of the ten houses on a block? Compare that to a free streamer that reaches eight of ten homes but buries your ad in a pod of fifteen others per hour has sold you a reach number but left out the quality of attention.
The Unifed Streaming Power Index (USPI) treats addressable household reach as the foundation and then layers in the factors that determine whether that reach converts into meaningful attention:
- What are those households watching right now?
- How engaged are they?
- How cluttered is the environment your ad lives in?
- What are you paying per thousand for the privilege of being there?
These are the questions the current measurement infrastructure struggles to answer in a unified way. The USPI is our attempt to answer them directionally, in the open, using publicly available viewership data and reported ad inventory characteristics.
How the Index Works
The index is built on twelve consecutive weeks of open-source viewership data from January through March 2026 and calibrated against the advertising inventory characteristics of an initial seventeen streaming apps for consideration. Each platform is scored on a ten-point composite scale across six weighted dimensions.
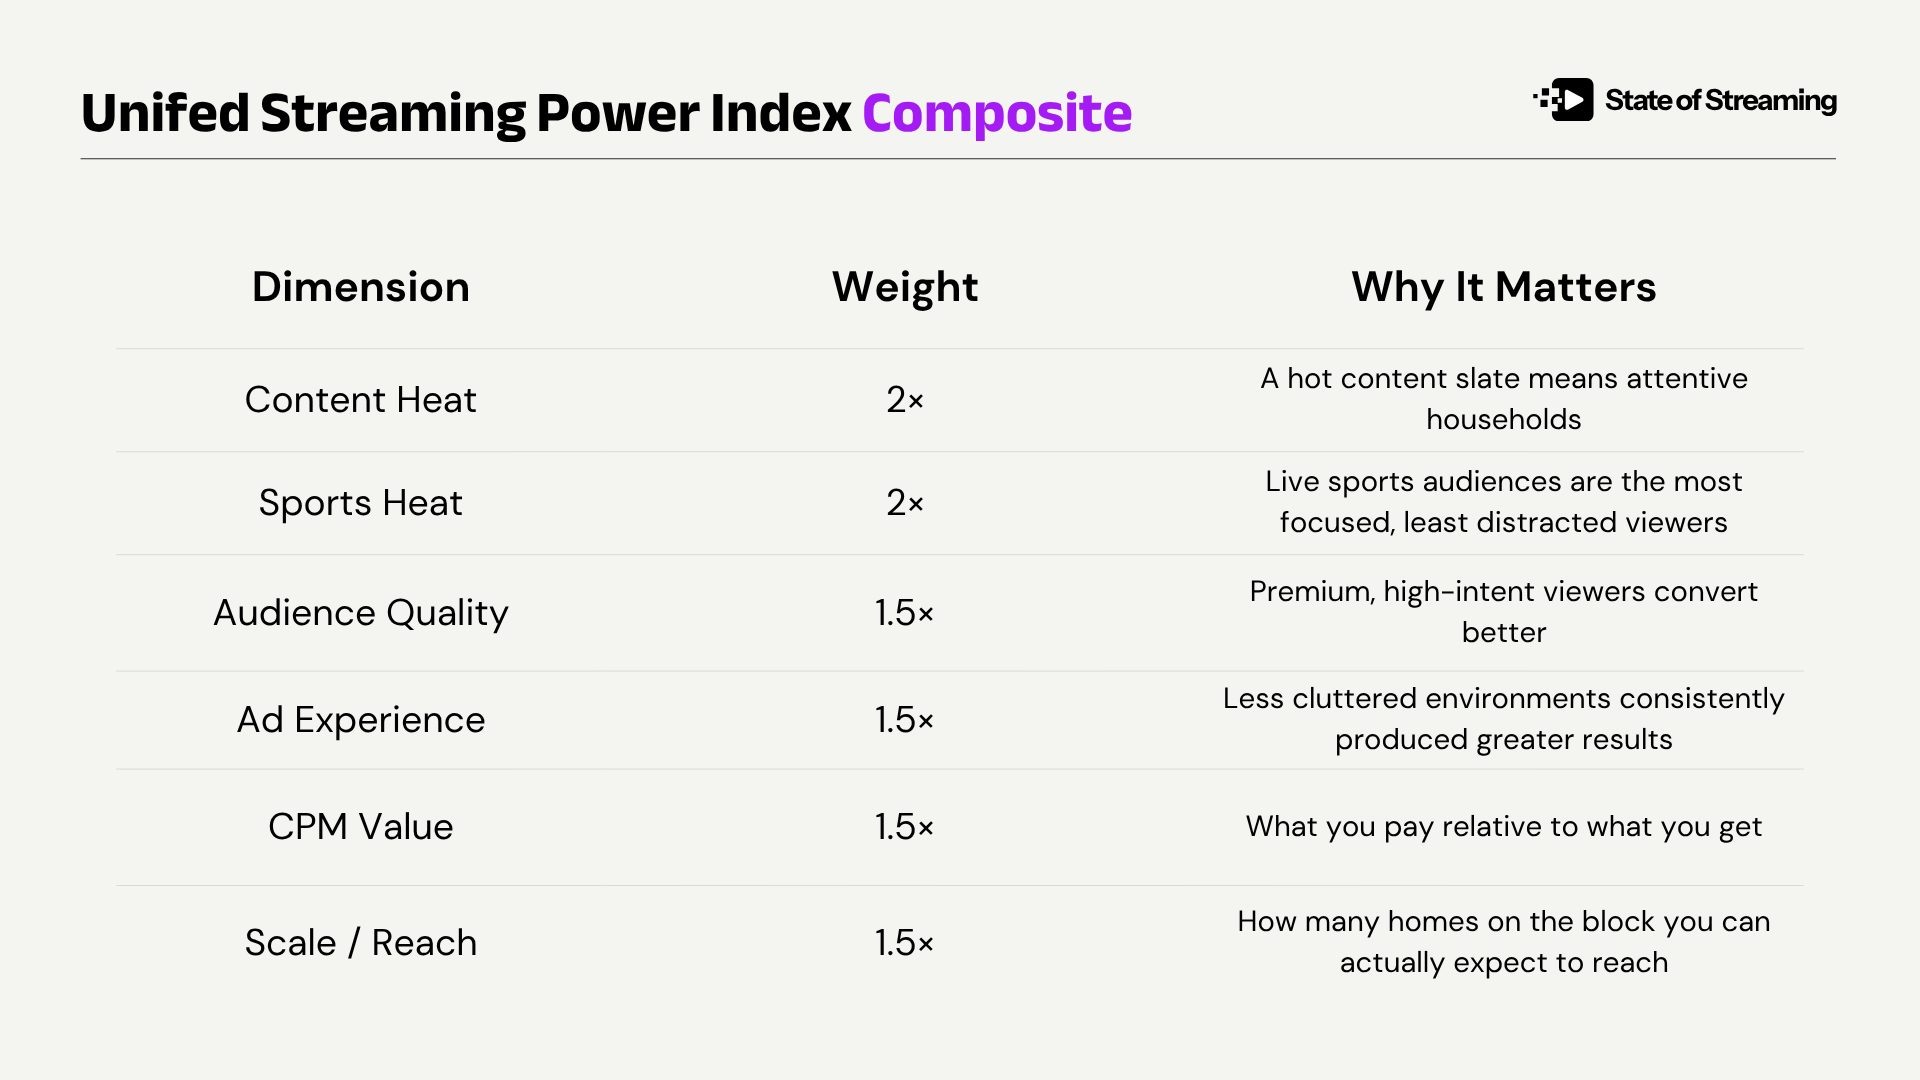
Content and sports carry the heaviest weight because live viewership velocity is the strongest leading indicator of attentive households. A home tuned into a record-breaking NFL playoff game or a series premiere averaging thirteen million viewers per episode is a home that is paying attention, not mindlessly scrolling a second screen.
This is meant to be intentionally directional, not definitive. We are building this in the open because the alternative, waiting for the industry to agree on a single source of truth, means planning against someone else's math indefinitely. As we wrote two weeks ago: the buyers who bring independent data and a clear view of the landscape will negotiate from strength. This index is one tool toward that end.
A Note on the Numbers
Not every platform reports reach the same way. Some publish paid subscribers. Others report monthly active users, logged-in households, unique ad-supported accounts, or nothing at all. There is no industry-standard definition of "addressable reach" that every streaming app uses consistently.
We resolved these inconsistent inputs into a directional estimate of U.S. addressable households per platform, benchmarked against the 101,582,619 U.S. Census households with broadband (cable, fiber optic, or DSL). Where a platform publishes figures, we used them. Where they don't, we relied on the best available third-party estimates, earnings disclosures, and trade reporting.
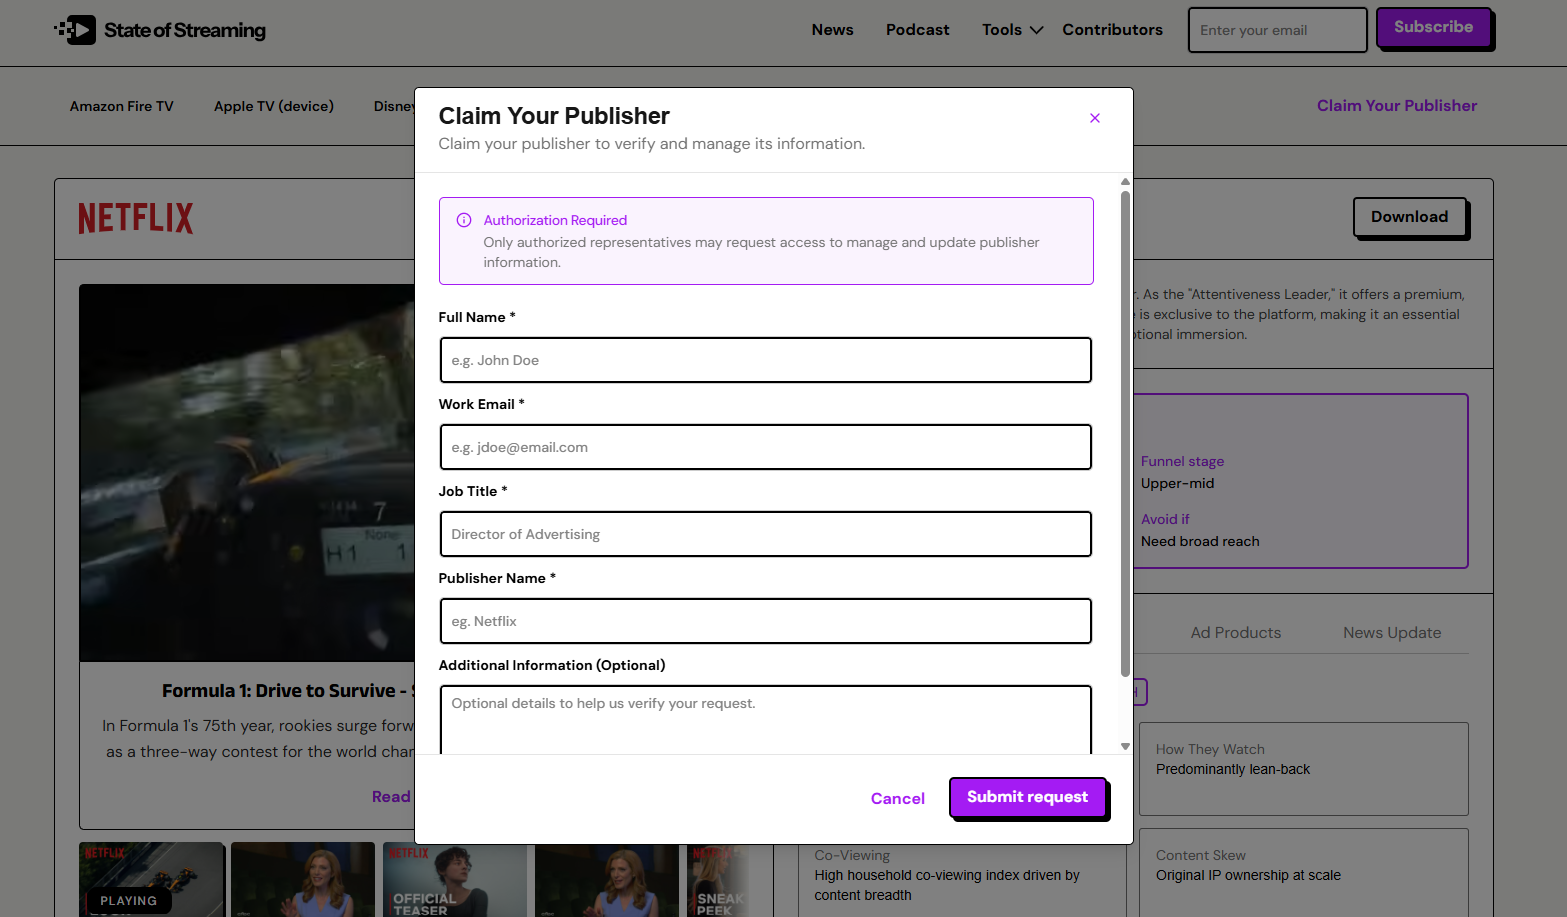
The percentages below are directional, not exact. As platforms update their disclosures and publishers claim their own listings on The Grid, the numbers will sharpen. If your platform's number is wrong, tell us. We will update it. You can get in touch with Nicholas Cardoso, Editorial Lead at nick@stateofstreaming.com or by clicking the 'Claim Your Publisher' button from any page within The Grid.
What the Rankings Tell Us
The top finding is an arbitrage opportunity.
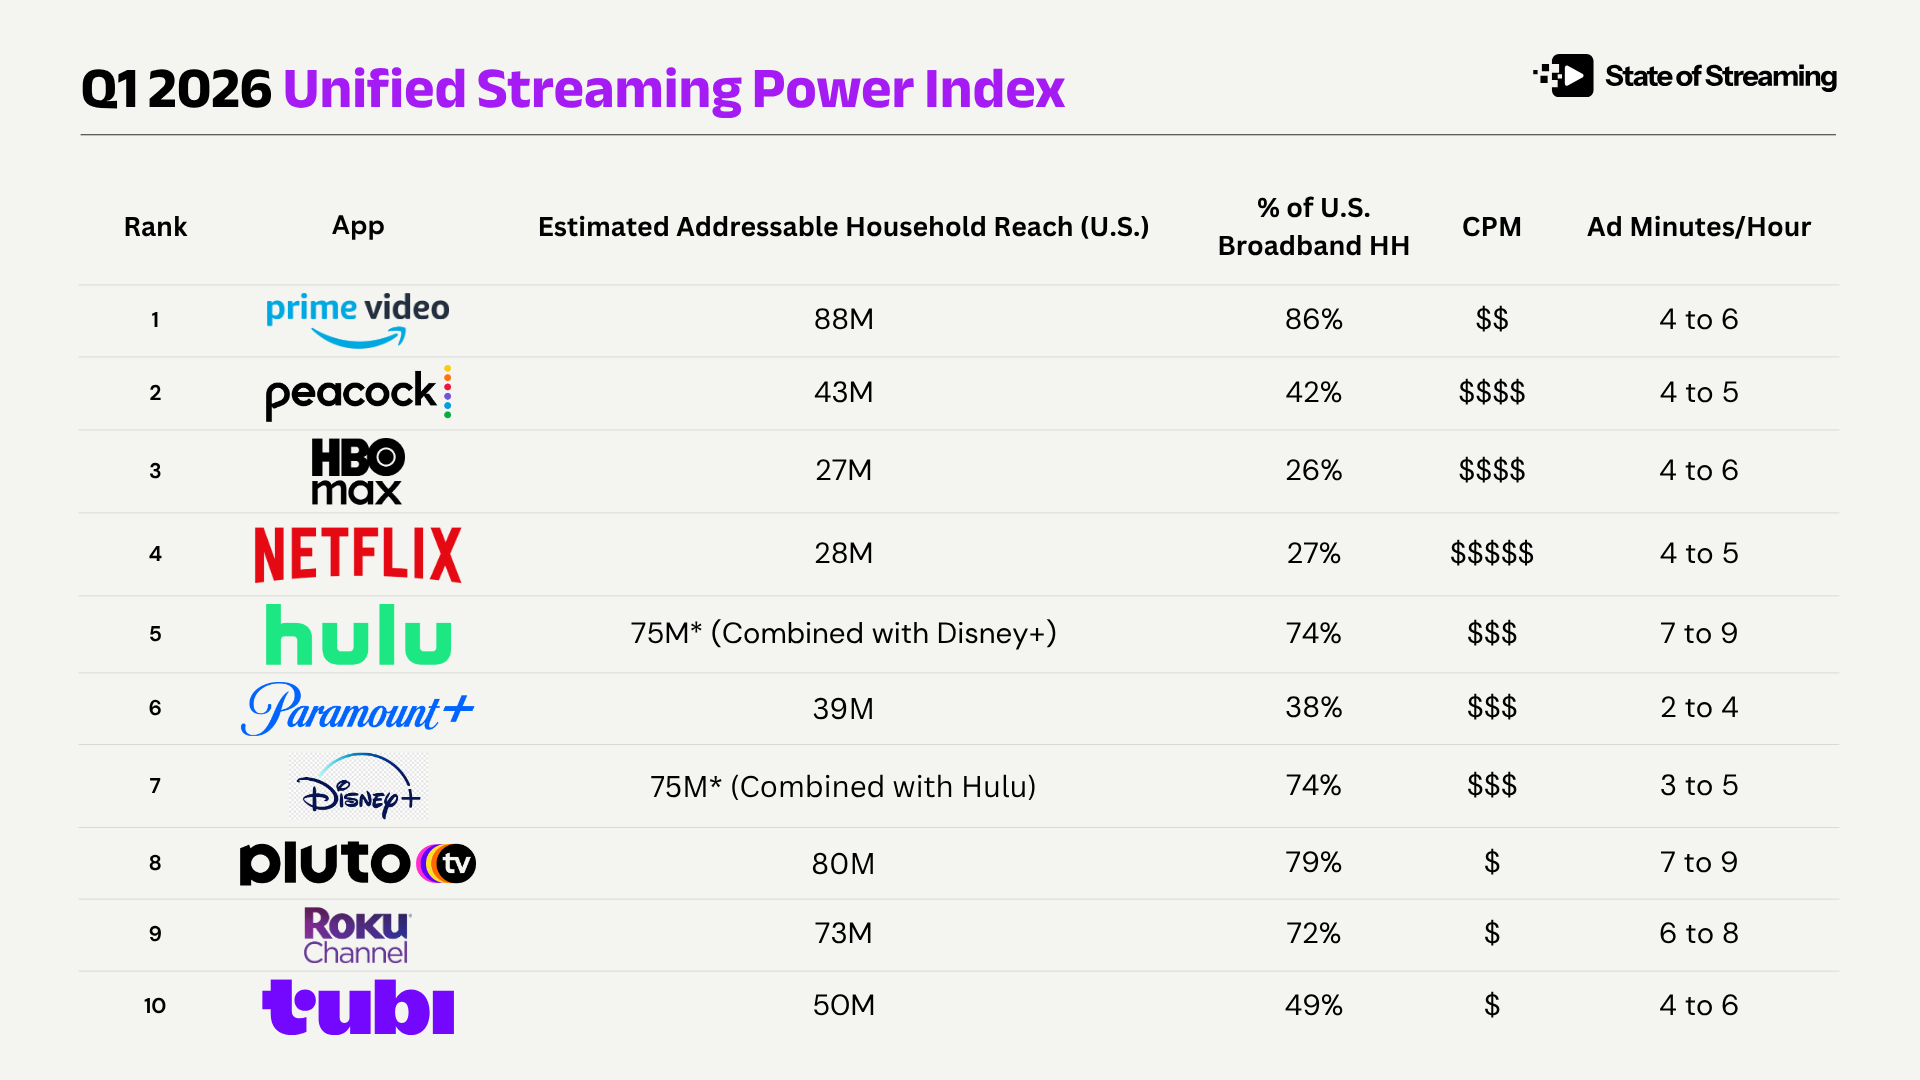
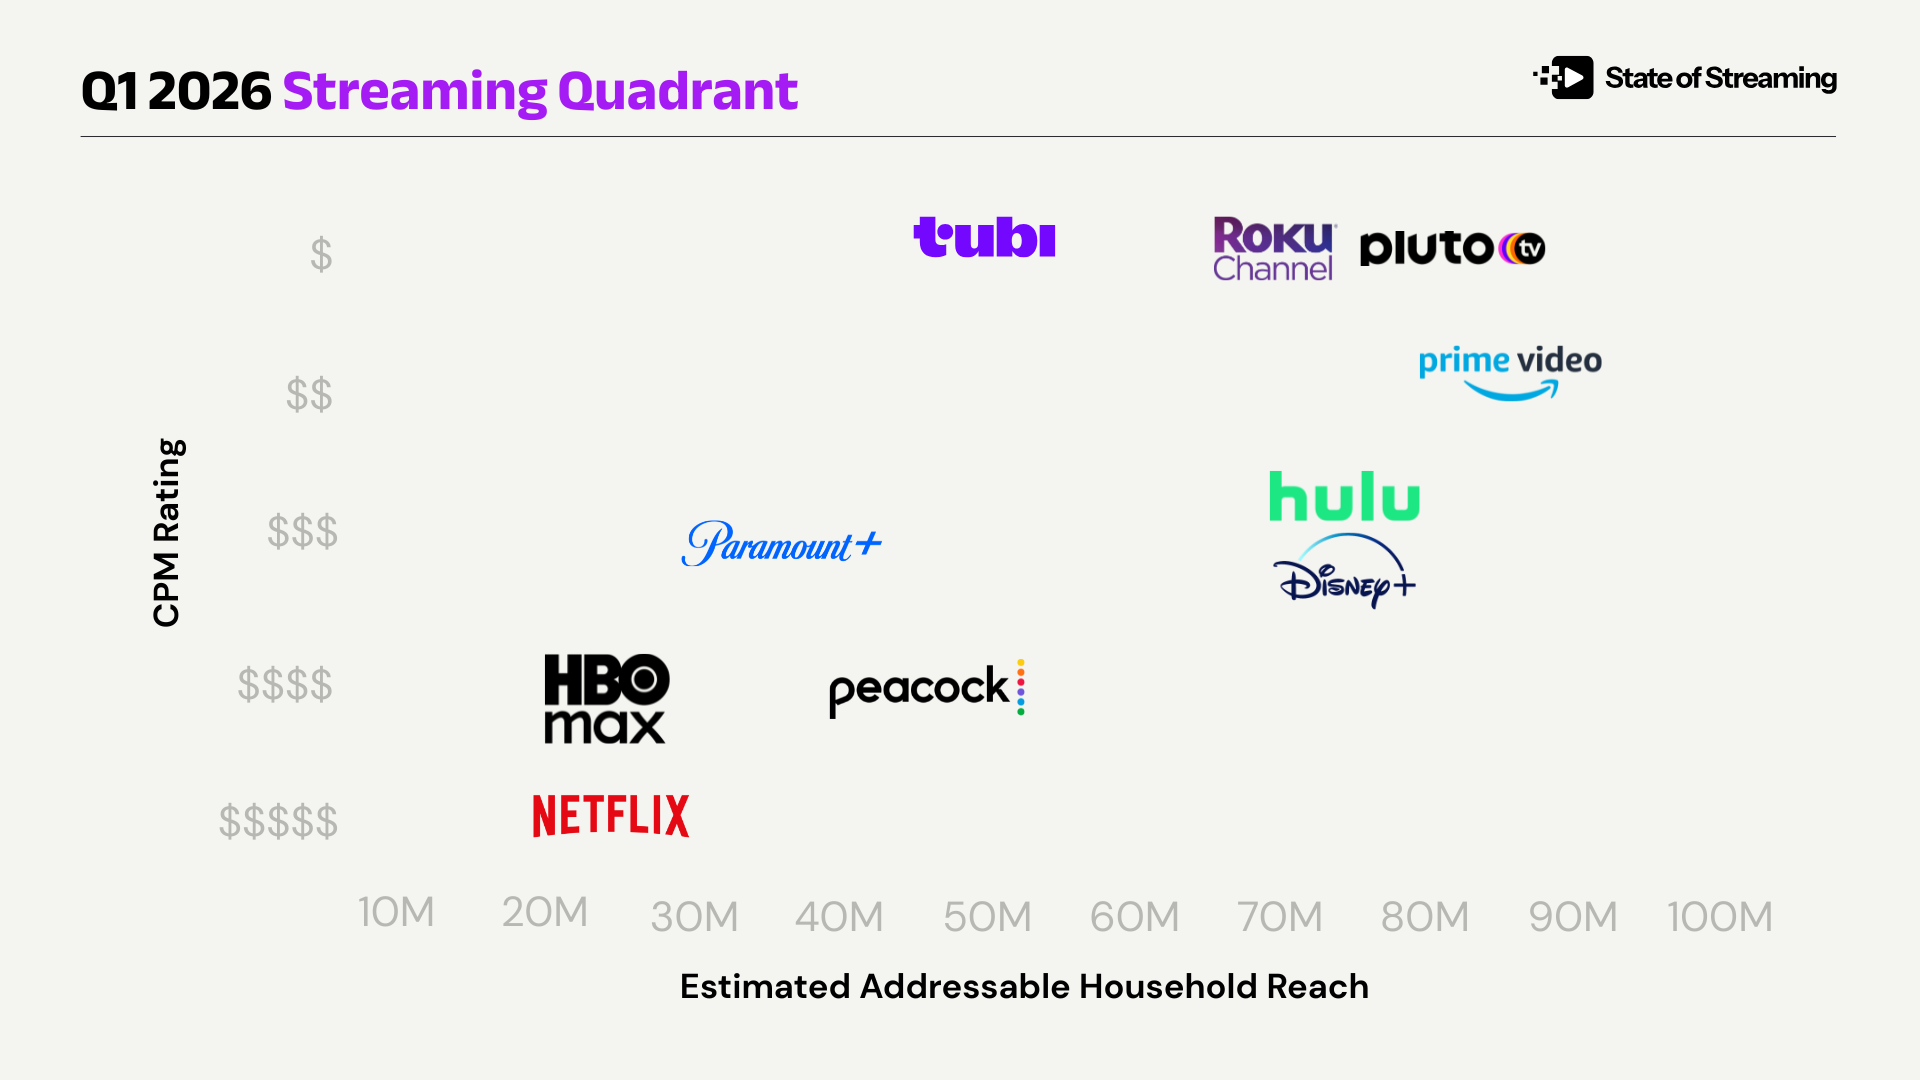
HBO Max and Netflix reach virtually the same estimated number of ad-tier homes: 27M and 28M. HBO CPMs come in lower while running a scripted slate of comparable or greater heat this quarter. For buyers evaluating attention per dollar at the household level, HBO Max may be the most undervalued opportunity in the market.
Prime Video wins on range.
No other single platform combines 88M premium reach, record-setting live sports, strong entertainment tentpoles, and mid-tier CPM in one line item. In the context of our earlier reporting on Amazon building a self-contained advertising economy with 22% Q4 ad revenue growth, this is an entry point into the most complete closed-loop system in streaming.
Peacock wins on attention density.
Two to four ads per hour against Super Bowl, Olympics, and Sunday Night Football audiences means your impression gets more focused attention here than anywhere else in premium streaming. At a time when 72% of viewers say ad relevance hasn't improved in five years, Peacock's low-clutter model is the structural counterargument.
Biggest risers (composite pulled them up):
- Peacock jumps from reach rank #7 (42%) to USPI #2. A perfect 10/10 sports heat score does that. The Super Bowl, Olympics, and SNF give it more weighted points from a single dimension than some platforms earn across all six.
- HBO Max rises from reach rank #9 (26%) to USPI #3. A 10/10 content heat score at 2x weight overrides a smaller reach footprint. KOSK at 13M viewers per episode and Pitt at 12M per episode are doing the heavy lifting.
- Netflix rises from reach rank #8 (27%) to USPI #4. Same content heat advantage as HBO, but its 2/10 CPM value score (highest CPM in market) holds it below HBO. That one dimension is the entire gap between #3 and #4.
Biggest fallers (composite pushed them down):
- Pluto TV drops from reach rank #2 (79%) to USPI #8. It has 9/10 on reach and 10/10 on CPM value, but content heat of 2 and sports heat of 1 at 2x weight holds it back.
- Roku Channel drops from reach rank #3 (72%) to USPI #9. Same story as Pluto.
- Hulu drops from reach rank #4 (74%) to USPI #5. Its 4/10 ad experience (7-9 ads/hr) and 2/10 sports heat drag it below apps with less reach.
What Comes Next
This is a living index and the first step in a longer buildout of The Grid.
We have 285+ more apps to add. The methodology will evolve as the data improves. We welcome feedback, corrections, and contributions from publishers, buyers, and measurement partners. If you want to get listed, claim your app, or challenge a metric, please get in touch (tim@stateofstreaming.com).
Content slates will turn over. Sports calendars will shift. Platforms will adjust their pricing and ad loads. The rankings will move with them. But the question at the center will stay the same.
How many homes on the block can you reach, and how much of their attention are you actually buying?
The first quarter of 2026 gave us a clear answer. This is where the market stands today.
Get the SOS. Brief
The sharpest streaming intelligence, delivered to your inbox.