Same Screen. Five Different Businesses.
HOT TAKE INCOMING: Streaming is not an industry. It is a battle ground for attention comprised of completely unique businesses that happen to compete for the same surface area.
Buyers allocating against "streaming" as a category are not buying an audience. They are buying different monetization architectures simultaneously and doing their best to price them accordingly.
Amazon sells purchase intent.
Prime Video is a behavioral signal collection operation with shows in it. Every minute of viewing feeds the identity graph that powers $17.2 billion in quarterly advertising revenue — up 24% year over year, trailing twelve months above $70 billion. The ad impression is not the product. The transaction and household-level measurement is.

Disney sells the experience.
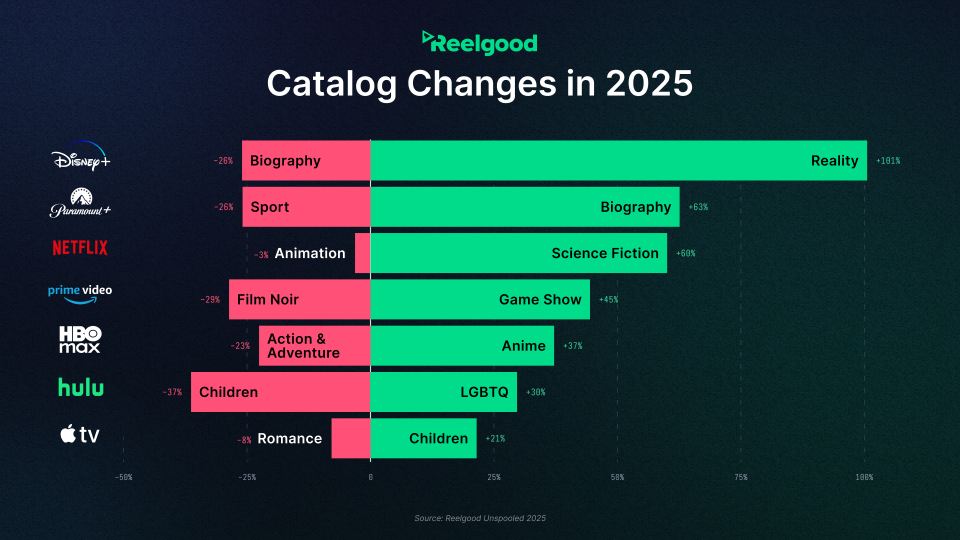
The screen is the top of a funnel that ends at a theme park gate. Marvel, Star Wars, Pixar — these franchises exist to manufacture demand for experiences that carry margins streaming never will. Reelgood catalog data shows Disney+ cut biography content 26% in 2025 and doubled reality programming. That is a franchise adjacency decision. Disney+ is a $9.99 loyalty program. The conversion event is a $10,000 vacation.
Netflix sells the next episode.
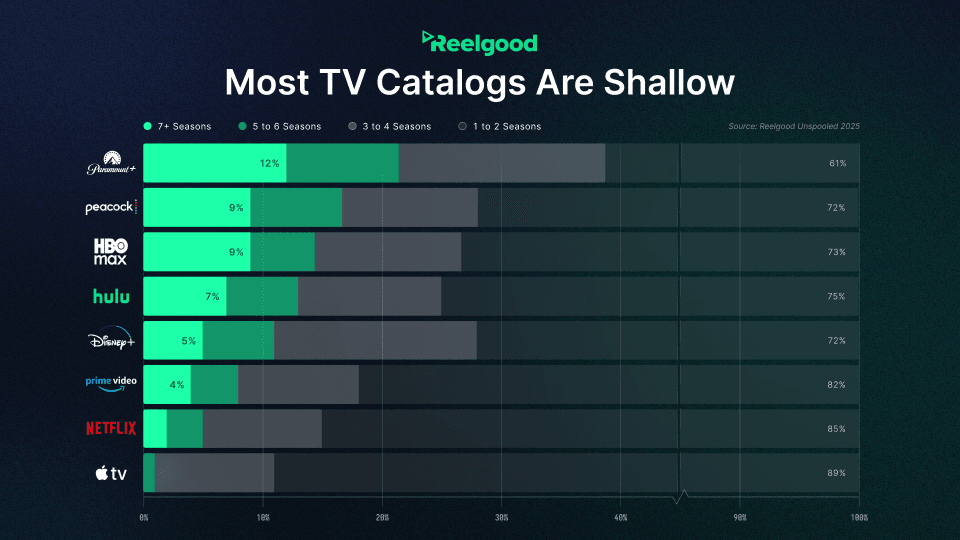
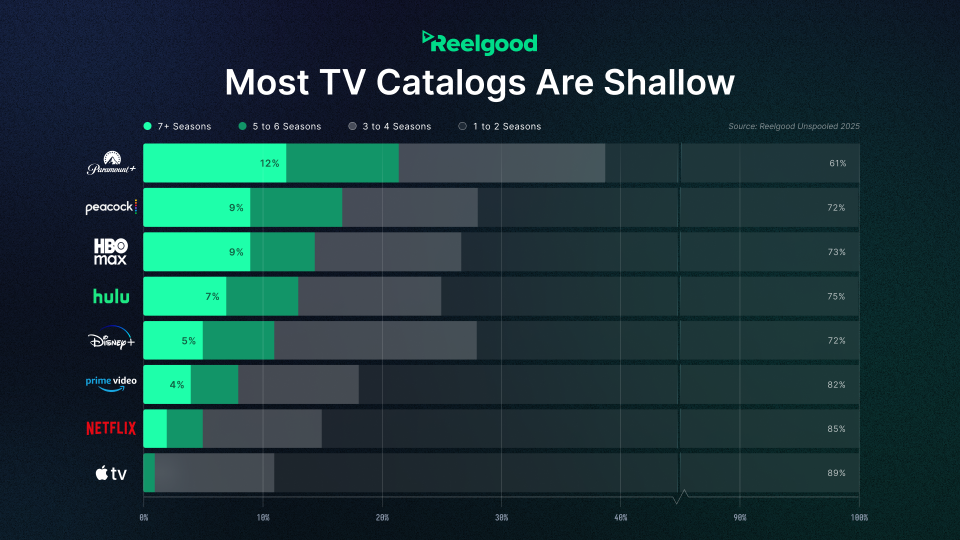
No hardware. No parks. No commerce loop. No identity graph it owns. Just attention, monetized through subscription and a $3 billion ad business scaling on infrastructure powered-by Amazon. 85% of Netflix's TV catalog sits at one to two seasons, per Reelgood Unspooled 2025. Breadth over depth. Continuous new hooks over back catalog. It is the only pure content bet in the top tier — and the only platform with no second revenue leg if the content stops working.
Roku sells the toll booth.
Roku does not care what the viewer watches. It earns either way. Subscription revenue hit $519 million in Q1 2026, up 30%, at a 40% gross margin — without producing a meaningful frame of premium content. More than half of Peacock sign-ups on Roku in February came through the Roku Experience before the viewer ever opened the Peacock app. The OS intercepts the subscription moment.

YouTube sells the signal.
Every view on a connected television feeds back into the largest intent graph ever built. YouTube leads all platforms in U.S. TV screen time. The content is not the product. The signal the content generates is.
Read about YouTube becoming the largest media company in the world next

April | Unified Streaming Power Index

| Rank | Company | EST. HH. Reach % | CPM | Ad Mins. per Hour | April's Take |
|---|---|---|---|---|---|
| 1 |  | 86% | $$ | 4-6 | The only platform where the ad impression and the purchase confirmation live in the same closed loop — and that gap over every other platform on this list is widening, not narrowing. |
| 2 | 99% | $ | 6-8 | We only scored the channel last quarter and missed on our assessment. 100 million households, a 60.5% advertising gross margin, and the home screen every other platform on this list pays to appear on. | |
| 3 | 43% | $$$$ | 4-5 | The only platform in this index where what the market is paying and what the attention is worth tell the same story — and with the World Cup arriving in July, that story gets louder. | |
| 4 |  | 26% | $$$$ | 4-6 | The lowest disclosed ad load among premium platforms against content heat that matches or beats Netflix — the arbitrage is still open, and the market is closing it slower than it should. |
| 5 | 27% | $$$$$ | 4-5 | Ad spend grew 26% last year as buyers absorbed the highest cost per thousand in streaming — the mobile redesign and video podcast exclusives are building a second audience the current price floor has not yet reached. | |
| 6 | 74% (w/ Hulu) | $$$$ | 3-5 | Verts is the first credible vertical video infrastructure play in subscription streaming — the measurement standard does not exist yet, but the platform that owns the format when it does will own the inventory category. | |
| 7 | 74% (w/ Disney+) | $$$ | 7-9 | $4.69 billion in ad spend buys you seven to nine ad minutes per hour and an audience that rates ad relevance below the industry average — the gap between spend rank and composite rank is not closing until the ad load does. | |
| 8 | 49% | $ | 4-6 | Four to six ad minutes per hour, a World Cup audience funnel already in motion, and the only free platform in this index that reached profitability without a content acquisition budget — the cheapest attention in premium streaming and the trajectory is up. | |
| 9 | 38% | $$$ | 2-4 | The lowest ad load in the subscription tier at two to four minutes per hour is structurally underpriced — every buyer who passes on Paramount+ in favor of a higher-clutter platform is leaving attention quality on the table. | |
| 10 | 79% | $ | 7-9 | 79% broadband household reach at the lowest cost per thousand in the tier is a reach argument the market understands — what the market has not priced is that 7–9 ad minutes per hour on linear channels is eroding the attention quality that reach is supposed to deliver. | |
| 11 | 23% | $$ | 8–12 | Elite sports heat against a documented ad experience problem — commercial breaks on the streaming app run longer than cable, live feeds lag behind the linear signal, and the platform acknowledged the issue in October without resolving it. | |
| 12 | 29% | $ | 8–12 | 30 million U.S. households and automatic content recognition data moat that no app-based competitor can replicate — the platform that knows what every Samsung household watches across every input, not just its own. | |
| 13 | 20% | $ | 8–12 | The Anoki Context IQ brand safety layer added real-time contextual targeting to live news inventory this month — the OEM tier's ad experience quality is improving, and LG is moving fastest. | |
| 14 | 13% | $ | 8–12 | Vizio's WatchFree+ puts Walmart's purchase data behind the same glass as the ad impression — the commerce signal no other smart television manufacturer in this index can match, and the market has not priced it yet. | |
| 15 | 49% | $ | 7–10 | The only disclosed ad load in the free streaming tier — 7 to 10 minutes per hour confirmed by Xumo's own leadership — backed by Comcast and Charter infrastructure and the FreeWheel ad stack that powers premium video buying at scale. |
Get the SOS. Brief
The sharpest streaming intelligence, delivered to your inbox.